使用 Hermes 进行分析
你可以使用 Hermes 在 React Native 应用中可视化 JavaScript 的性能。Hermes 是一个小型轻量级 JavaScript 引擎,针对运行 React Native 进行了优化(你可以 在此处阅读有关将其与 React Native 一起使用的更多信息)。Hermes 有助于提高应用性能,还公开了分析其运行的 JavaScript 性能的方法。
¥You can visualize JavaScript's performance in a React Native app using Hermes. Hermes is a small and lightweight JavaScript engine optimized for running React Native (you can read more about using it with React Native here). Hermes helps improve app performance and also exposes ways to analyze the performance of the JavaScript that it runs.
在本节中,你将学习如何分析在 Hermes 上运行的 React Native 应用以及如何使用 Chrome DevTools 上的“性能”选项卡 可视化该配置文件
¥In this section, you will learn how to profile your React Native app running on Hermes and how to visualize the profile using the Performance tab on Chrome DevTools
开始之前请务必先 在你的应用中启用 Hermes!
¥Be sure to enable Hermes in your app before you get started!
请按照以下说明开始分析:
¥Follow the instructions below to get started profiling:
记录 Hermes 采样配置文件
¥Record a Hermes sampling profile
要从开发菜单记录采样分析器:
¥To record a sampling profiler from the Dev Menu:
-
导航到正在运行的 Metro 服务器终端。
¥Navigate to your running Metro server terminal.
-
按
d打开开发菜单。¥Press
dto open the Dev Menu. -
选择启用采样分析器。
¥Select Enable Sampling Profiler.
-
在你的应用中执行 JavaScript(按下按钮等)
¥Execute your JavaScript by in your app (press buttons, etc.)
-
再次按
d打开开发菜单。¥Open the Dev Menu by pressing
dagain. -
选择禁用采样分析器以停止记录并保存采样分析器。
¥Select Disable Sampling Profiler to stop recording and save the sampling profiler.
Toast 将显示采样分析器的保存位置,通常在 /data/user/0/com.appName/cache/*.cpuprofile
¥A toast will show the location where the sampling profiler has been saved, usually in /data/user/0/com.appName/cache/*.cpuprofile

从 CLI 执行命令
¥Execute command from CLI
你可以使用 React Native CLI 将 Hermes 跟踪配置文件转换为 Chrome 跟踪配置文件,然后使用以下命令将其拉取到本地计算机:
¥You can use the React Native CLI to convert the Hermes tracing profile to Chrome tracing profile, and then pull it to your local machine using:
npx react-native profile-hermes [destinationDir]
启用源映射
¥Enabling source map
你可以在 调试发布版本 页面上阅读有关源映射的信息。
¥You may read about source maps on the Debugging Release Builds page.
常见错误
¥Common errors
adb: no devices/emulators found 或 adb: device offline
¥adb: no devices/emulators found or adb: device offline
-
为什么会发生这种情况 CLI 无法访问你用于运行应用的设备或模拟器(通过 adb)。
¥Why this happens The CLI cannot access the device or emulator (through adb) you are using to run the app.
-
如何修复 确保你的 Android 设备/模拟器已连接并正在运行。该命令仅在可以访问 adb 时才有效。
¥How to fix Make sure your Android device/emulator is connected and running. The command only works when it can access adb.
There is no file in the cache/ directory
-
为什么会发生这种情况 CLI 在应用的缓存/目录中找不到任何 .cpuprofile 文件。你可能忘记从设备记录配置文件。
¥Why this happens The CLI cannot find any .cpuprofile file in your app's cache/ directory. You might have forgotten to record a profile from the device.
-
如何修复 按照 instructions 从设备启用/禁用分析器。
¥How to fix Follow the instructions to enable/disable profiler from device.
Error: your_profile_name.cpuprofile is an empty file
-
为什么会出现这种情况 配置文件为空,可能是因为 Hermes 运行不正确。
¥Why this happens The profile is empty, it might be because Hermes is not running correctly.
-
如何修复确保你的应用在最新版本的 Hermes 上运行。
¥How to fix Make sure your app is running on the latest version of Hermes.
在 Chrome DevTools 中打开下载的配置文件
¥Open the downloaded profile in Chrome DevTools
要在 Chrome DevTools 中打开配置文件:
¥To open the profile in Chrome DevTools:
-
打开 Chrome 开发者工具。
¥Open Chrome DevTools.
-
选择性能选项卡。
¥Select the Performance tab.
-
右键单击并选择加载配置文件...
¥Right click and choose Load profile...

Hermes Profile Transformer 是如何工作的?
¥How does the Hermes Profile Transformer work?
Hermes Sample Profile 是 JSON object format,而 Google 的 DevTools 支持的格式是 JSON Array Format。(有关格式的更多信息可以在 跟踪事件格式文档 上找到)
¥The Hermes Sample Profile is of the JSON object format, while the format that Google's DevTools supports is JSON Array Format. (More information about the formats can be found on the Trace Event Format Document)
export interface HermesCPUProfile {
  traceEvents: SharedEventProperties[];
  samples: HermesSample[];
  stackFrames: {[key in string]: HermesStackFrame};
}
Hermes 配置文件的大部分信息都编码到 samples 和 stackFrames 属性中。每个样本都是该特定时间戳处函数调用堆栈的快照,因为每个样本都有一个与函数调用相对应的 sf 属性。
¥The Hermes profile has most of its information encoded into the samples and stackFrames properties. Each sample is a snapshot of the function call stack at that particular timestamp as each sample has a sf property which corresponds to a function call.
export interface HermesSample {
  cpu: string;
  name: string;
  ts: string;
  pid: number;
  tid: string;
  weight: string;
  /**

   * Will refer to an element in the stackFrames object of the Hermes Profile
   */
  sf: number;
  stackFrameData?: HermesStackFrame;
}
有关函数调用的信息可以在 stackFrames 中找到,其中包含键-对象对,其中键是 sf 编号,相应的对象为我们提供了有关该函数的所有相关信息,包括其父函数的 sf 编号。这种父子关系可以向上追踪,以找到在特定时间戳运行的所有函数的信息。
¥The information about a function call can be found in stackFrames which contains key-object pairs, where the key is the sf number and the corresponding object gives us all the relevant information about the function including the sf number of its parent function. This parent-child relationship can be traced upwards to find the information of all the functions running at a particular timestamp.
export interface HermesStackFrame {
  line: string;
  column: string;
  funcLine: string;
  funcColumn: string;
  name: string;
  category: string;
  /**

   * A parent function may or may not exist
   */
  parent?: number;
}
此时,你应该再定义几个术语,即:
¥At this point, you should define a few more terms, namely:
-
节点:
stackFrames中sf号对应的对象¥Nodes: The objects corresponding to
sfnumbers instackFrames -
活跃节点:当前在特定时间戳运行的节点。如果节点的
sf号位于函数调用堆栈中,则该节点被归类为正在运行。该调用堆栈可以从样本的sf号中获取,并向上追踪,直到父sf可用。¥Active Nodes: The nodes which are currently running at a particular timestamp. A node is classified as running if its
sfnumber is in the function call stack. This call stack can be obtained from thesfnumber of the sample and tracing upwards till parentsfs are available
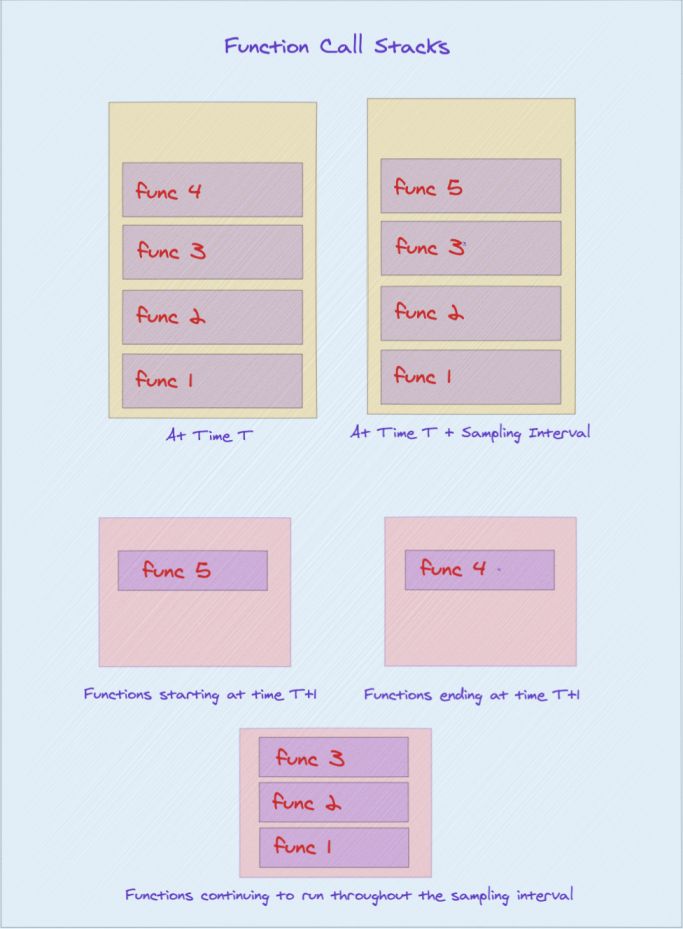
然后可以使用 samples 和 stackFrames 串联来生成相应时间戳处的所有开始和结束事件,其中:
¥The samples and the stackFrames in tandem can then be used to generate all the start and end events at the corresponding timestamps, wherein:
-
启动节点/事件:前一个示例的函数调用堆栈中不存在但当前示例中存在的节点。
¥Start Nodes/Events: Nodes absent in the previous sample's function call stack but present in the current sample's.
-
结束节点/事件:节点存在于前一个示例的函数调用堆栈中,但不存在于当前示例的函数调用堆栈中。
¥End Nodes/Events: Nodes present in the previous sample's function call stack but absent in the current sample's.
现在,你可以构造 flamechart 个函数调用,因为你拥有所有函数信息(包括其开始和结束时间戳)。
¥You can now construct a flamechart of function calls as you have all the function information including its start and end timestamps.
hermes-profile-transformer 可以将使用 Hermes 生成的任何配置文件转换为可以直接在 Chrome DevTools 中显示的格式。有关这方面的更多信息可以在 @react-native-community/hermes-profile-transformer 上找到
¥The hermes-profile-transformer can convert any profile generated using Hermes into a format that can be directly displayed in Chrome DevTools. More information about this can be found on @react-native-community/hermes-profile-transformer