调试基础知识
在发布(生产)版本中禁用调试功能,例如 Dev Menu、LogBox 和 React Native DevTools。
¥Debugging features, such as the Dev Menu, LogBox, and React Native DevTools are disabled in release (production) builds.
打开 Dev 菜单
¥Opening the Dev Menu
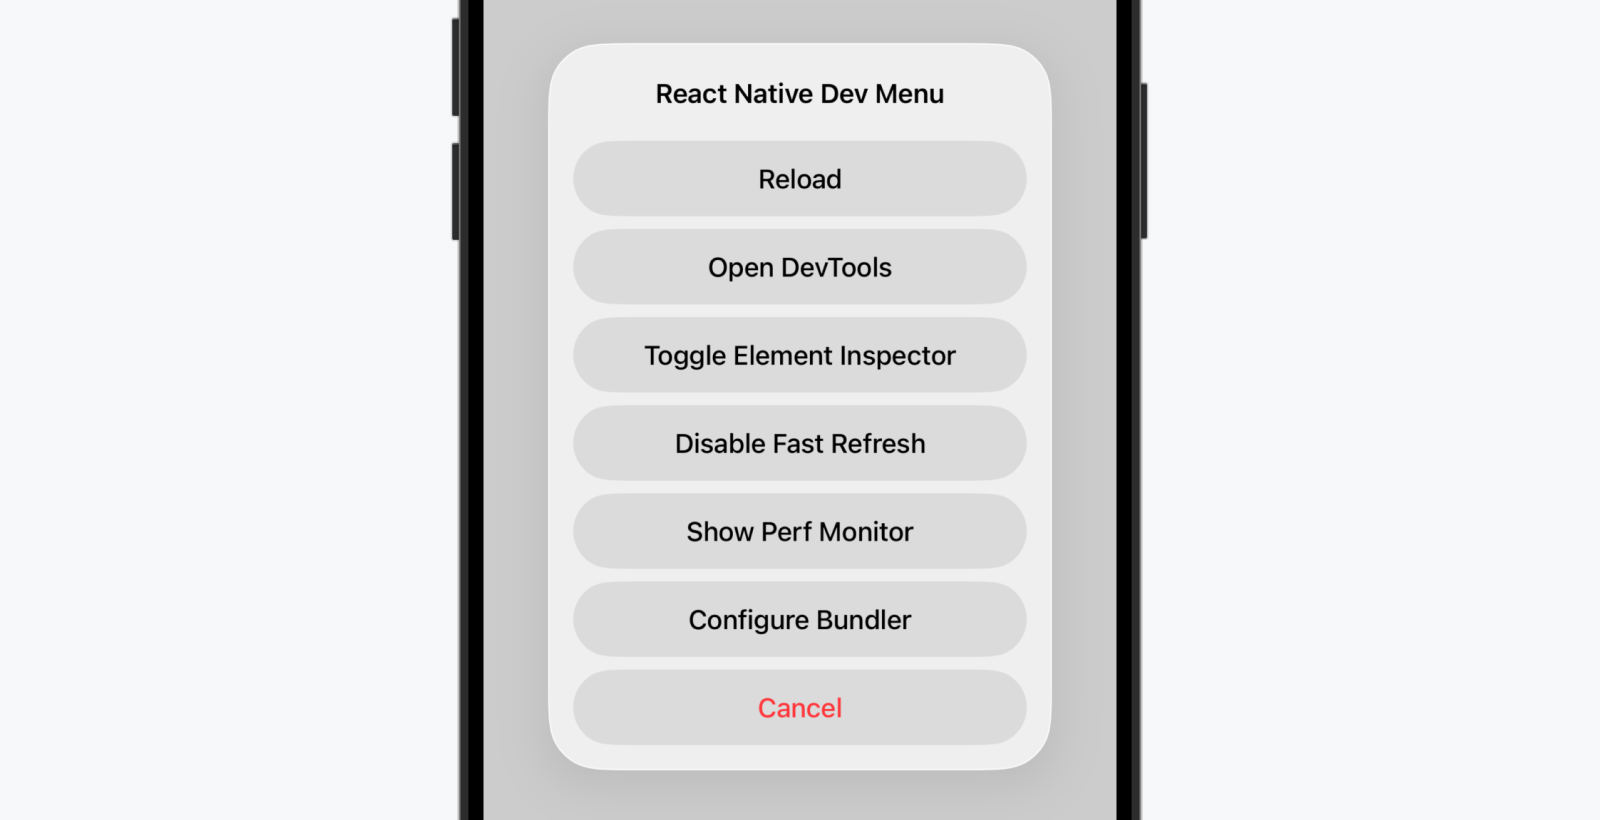
React Native 提供了一个应用内开发者菜单,可访问调试功能。你可以通过摇动设备或通过键盘快捷键来访问开发菜单:
¥React Native provides an in-app developer menu providing access to debugging features. You can access the Dev Menu by shaking your device or via keyboard shortcuts:
-
iOS 模拟器:Ctrl + Cmd ⌘ + Z(或设备 > 摇动)
¥iOS Simulator: Ctrl + Cmd ⌘ + Z (or Device > Shake)
-
安卓模拟器:Cmd ⌘ + M (macOS) 或 Ctrl + M(Windows 和 Linux)
¥Android emulators: Cmd ⌘ + M (macOS) or Ctrl + M (Windows and Linux)
替代方案(Android):adb shell input keyevent 82。
¥Alternative (Android): adb shell input keyevent 82.
打开 DevTools
¥Opening DevTools
React Native DevTools 是我们为 React Native 内置的调试器。它允许你检查和了解你的 JavaScript 代码的运行方式,类似于 Web 浏览器。
¥React Native DevTools is our built-in debugger for React Native. It allows you to inspect and understand how your JavaScript code is running, similar to a web browser.
要打开 DevTools,请执行以下操作之一:
¥To open DevTools, either:
-
在 Dev Menu 中选择 "打开 DevTools"。
¥Select "Open DevTools" in the Dev Menu.
-
从 CLI 按下 j。
¥Press j from the CLI.
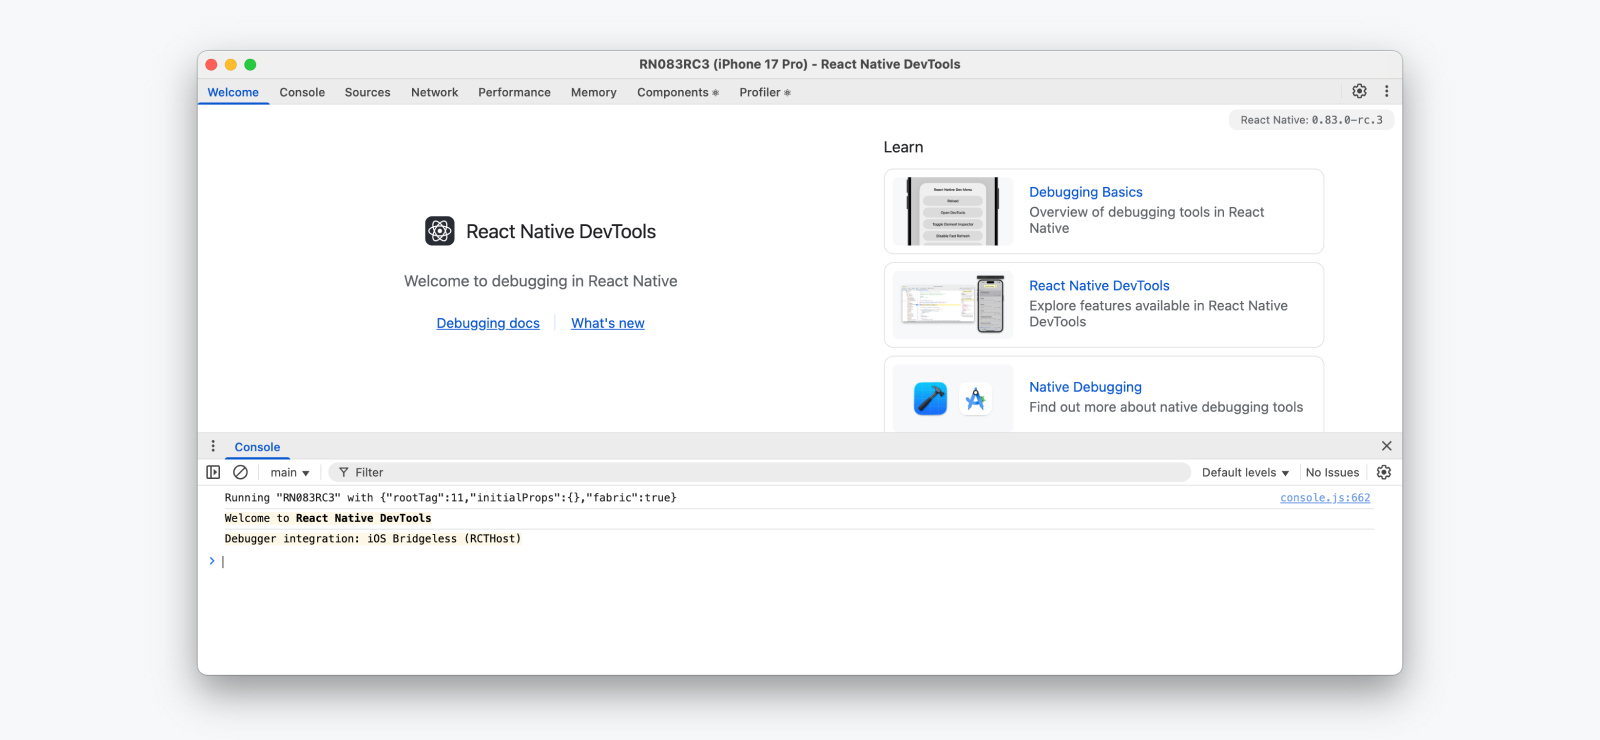
首次启动时,DevTools 将打开一个欢迎面板,以及一个打开的控制台抽屉,你可以在其中查看日志并与 JavaScript 运行时进行交互。从窗口顶部,你可以导航到其他面板,包括集成的 React Components Inspector 和 Profiler。
¥On first launch, DevTools will open to a welcome panel, along with an open console drawer where you can view logs and interact with the JavaScript runtime. From the top of the window, you can navigate to other panels, including the integrated React Components Inspector and Profiler.
在我们的 React Native DevTools 指南 中了解更多信息。
¥Learn more in our React Native DevTools guide.
LogBox
LogBox 是一个应用内工具,当你的应用记录警告或错误时会显示该工具。
¥LogBox is an in-app tool that displays when warnings or errors are logged by your app.
致命错误
¥Fatal Errors
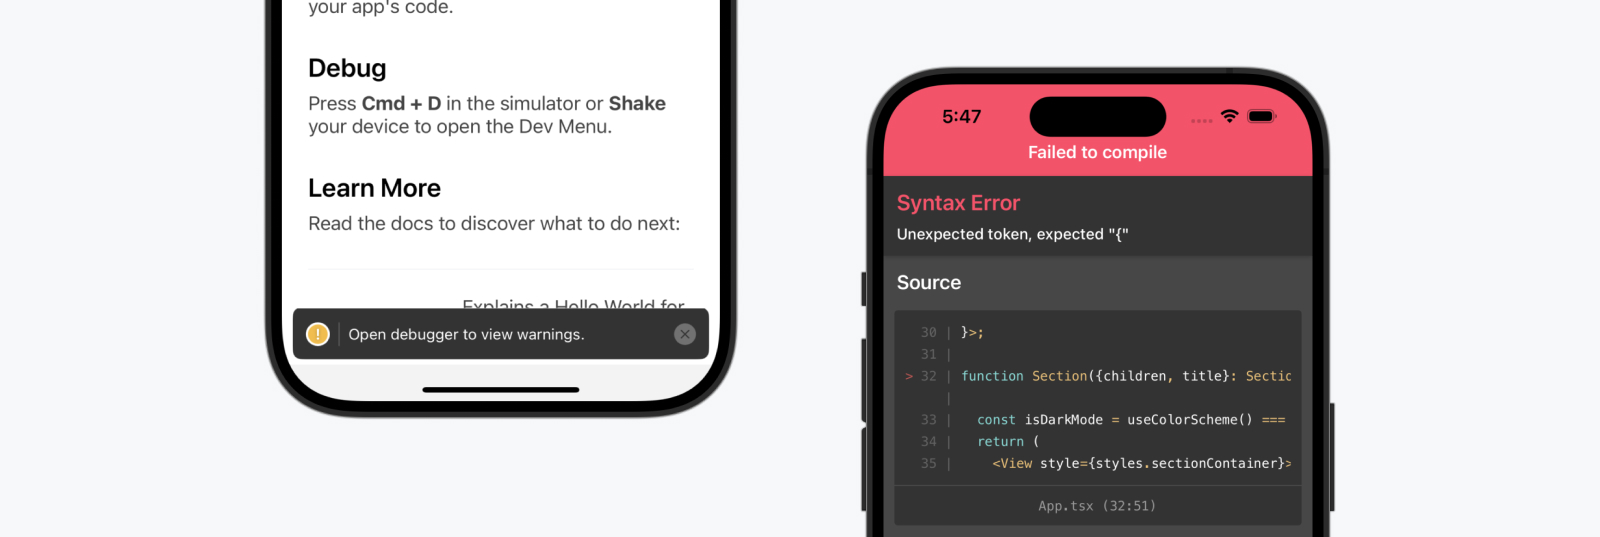
当发生不可恢复的错误(例如 JavaScript 语法错误)时,LogBox 将打开并显示错误位置。在这种状态下,LogBox 不可关闭,因为你的代码无法执行。一旦修复了语法错误,LogBox 将自动关闭 - 通过快速刷新或手动重新加载后。
¥When an unrecoverable error occurs, such as a JavaScript syntax error, LogBox will open with the location of the error. In this state, LogBox is not dismissable since your code cannot be executed. LogBox will automatically dismiss once the syntax error is fixed — either via Fast Refresh or after a manual reload.
控制台错误和警告
¥Console Errors and Warnings
控制台错误和警告显示为带有红色或黄色徽章的屏幕通知。
¥Console errors and warnings are displayed as on-screen notifications with a red or yellow badge.
-
错误将显示通知计数。点击通知以查看扩展视图并分页浏览其他日志。
¥Errors will display with a notification count. Tap the notification to see an expanded view and to paginate through other logs.
-
警告将显示一个没有详细信息的通知横幅,提示你打开 React Native DevTools。
¥Warnings will display a notification banner without details, prompting you to open React Native DevTools.
当 React Native DevTools 打开时,除致命错误之外的所有错误都将隐藏到 LogBox。我们建议使用 React Native DevTools 中的控制台面板作为事实来源,因为各种 LogBox 选项可以隐藏或调整某些日志的级别。
¥When React Native DevTools is open, all errors except fatal errors will be hidden to LogBox. We recommend using the Console panel within React Native DevTools as a source of truth, due to various LogBox options which can hide or adjust the level of certain logs.
💡 Ignoring logs
LogBox 可以通过 LogBox API 进行配置。
¥LogBox can be configured via the LogBox API.
import {LogBox} from 'react-native';
忽略所有日志
¥Ignore all logs
可以使用 LogBox.ignoreAllLogs() 禁用 LogBox 通知。这在提供产品演示等情况下很有用。
¥LogBox notifications can be disabled using LogBox.ignoreAllLogs(). This can be useful in situations such as giving product demos.
LogBox.ignoreAllLogs();
忽略特定日志
¥Ignore specific logs
可以通过 LogBox.ignoreLogs() 根据每个日志禁用通知。这对于嘈杂的警告或无法修复的警告很有用,例如 在第三方依赖中。
¥Notifications can be disabled on a per-log basis via LogBox.ignoreLogs(). This can be useful for noisy warnings or those that cannot be fixed, e.g. in a third-party dependency.
LogBox.ignoreLogs([
  // Exact message
  'Warning: componentWillReceiveProps has been renamed',

  // Substring or regex match
  /GraphQL error: .*/,
]);
LogBox 会将来自 React 的某些错误视为警告,这意味着它们不会显示为应用内错误通知。高级用户可以通过使用 LogBoxData.setWarningFilter() 自定义 LogBox 的警告过滤器来更改此行为。
¥LogBox will treat certain errors from React as warnings, which will mean they don't display as an in-app error notification. Advanced users can change this behaviour by customising LogBox's warning filter using LogBoxData.setWarningFilter().
性能监视器
¥Performance Monitor
在 Android 和 iOS 上,可以在开发过程中通过在开发菜单中选择 "性能监视器" 来切换应用内性能覆盖。了解有关此功能的更多信息 此处。
¥On Android and iOS, an in-app performance overlay can be toggled during development by selecting "Perf Monitor" in the Dev Menu. Learn more about this feature here.
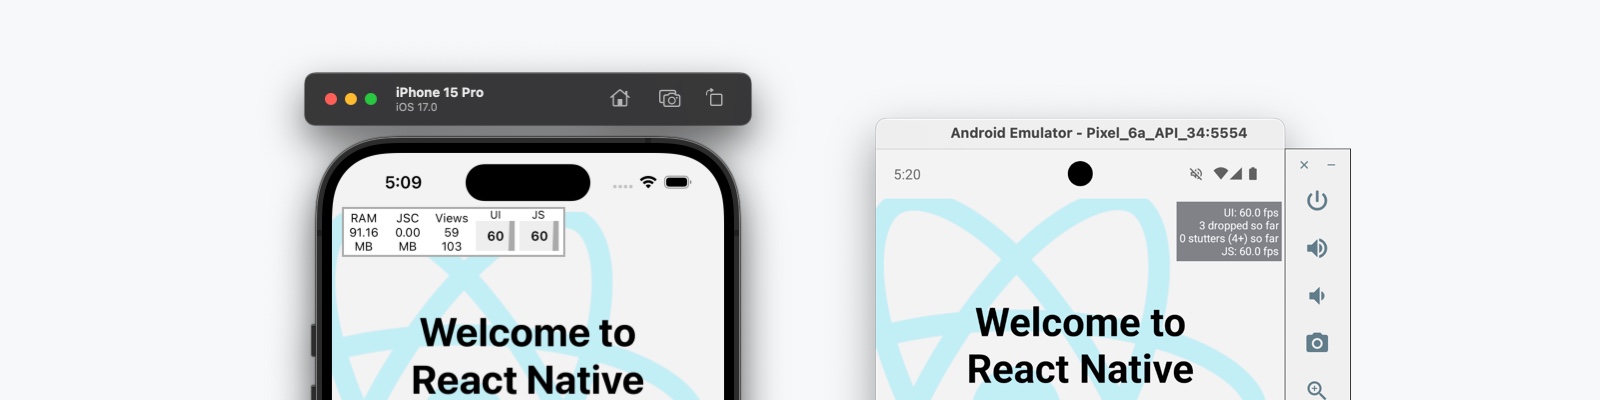
性能监视器在应用内运行并且是一个指南。我们建议研究 Android Studio 和 Xcode 下的原生工具,以进行准确的性能测量。
¥The Performance Monitor runs in-app and is a guide. We recommend investigating the native tooling under Android Studio and Xcode for accurate performance measurements.