
其他调试方法

除了 打开调试器 中描述的方法之外,本页还介绍了其他 JavaScript 调试方法。如果你使用新创建的 React Native 或 Expo 应用,我们建议从那里开始。

¥This page covers other JavaScript debugging methods besides what is described in Opening the Debugger. If you are using a newly created React Native or Expo app, we recommend starting there.

Safari 开发者工具(直接 JSC 调试)

¥Safari Developer Tools (direct JSC debugging)

当使用 JavaScript 核心 (JSC) 作为应用的运行时时,你可以使用 Safari 来调试应用的 iOS 版本。

¥You can use Safari to debug the iOS version of your app when using JavaScriptCore (JSC) as your app's runtime.

  1. 仅物理设备:打开“设置”应用,导航至 Safari > 高级,并确保 "网页检查器" 已打开。

    ¥Physical devices only: Open the Settings app, and navigate to Safari > Advanced, and make sure "Web Inspector" is turned on.

  2. 在 Mac 上,打开 Safari 并启用“开发”菜单。这可以在 Safari > 设置... 下找到,然后在高级选项卡中找到,然后选择 "为 Web 开发者展示功能"。

    ¥On your Mac, open Safari and enable the Develop menu. This can be found under Safari > Settings..., then the Advanced tab, then selecting "Show features for web developers".

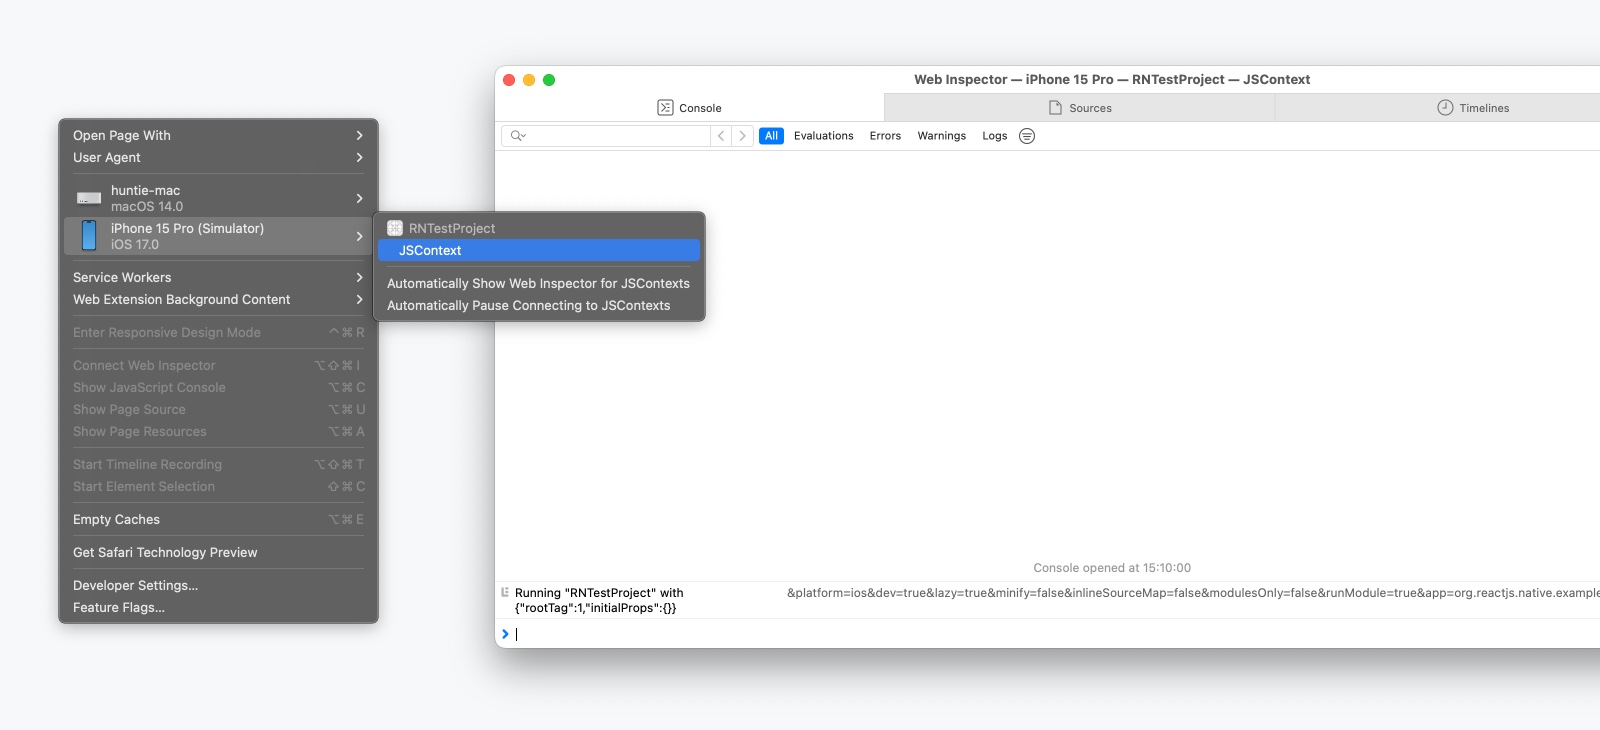
  3. 在开发菜单下找到你的设备,然后从子菜单中选择 "JSContext" 项。这将打开 Safari 的 Web Inspector,其中包括类似于 Chrome DevTools 的控制台和源面板。

    ¥Find your device under the Develop menu, and select the "JSContext" item from the submenu. This will open Safari's Web Inspector, which includes Console and Sources panels similar to Chrome DevTools.

Opening Safari Web Inspector

提示

虽然默认情况下源映射可能未启用,但你可以按照 本指南video 启用它们并在源代码中的正确位置设置断点。

¥While source maps may not be enabled by default, you can follow this guide or video to enable them and set break points at the right places in the source code.

提示

每次重新加载应用时,都会创建一个新的 JSContext。选择 "自动显示 JSContext 的 Web 检查器" 可以让你不必手动选择最新的 JSContext。

¥Every time the app is reloaded, a new JSContext is created. Choosing "Automatically Show Web Inspectors for JSContexts" saves you from having to select the latest JSContext manually.
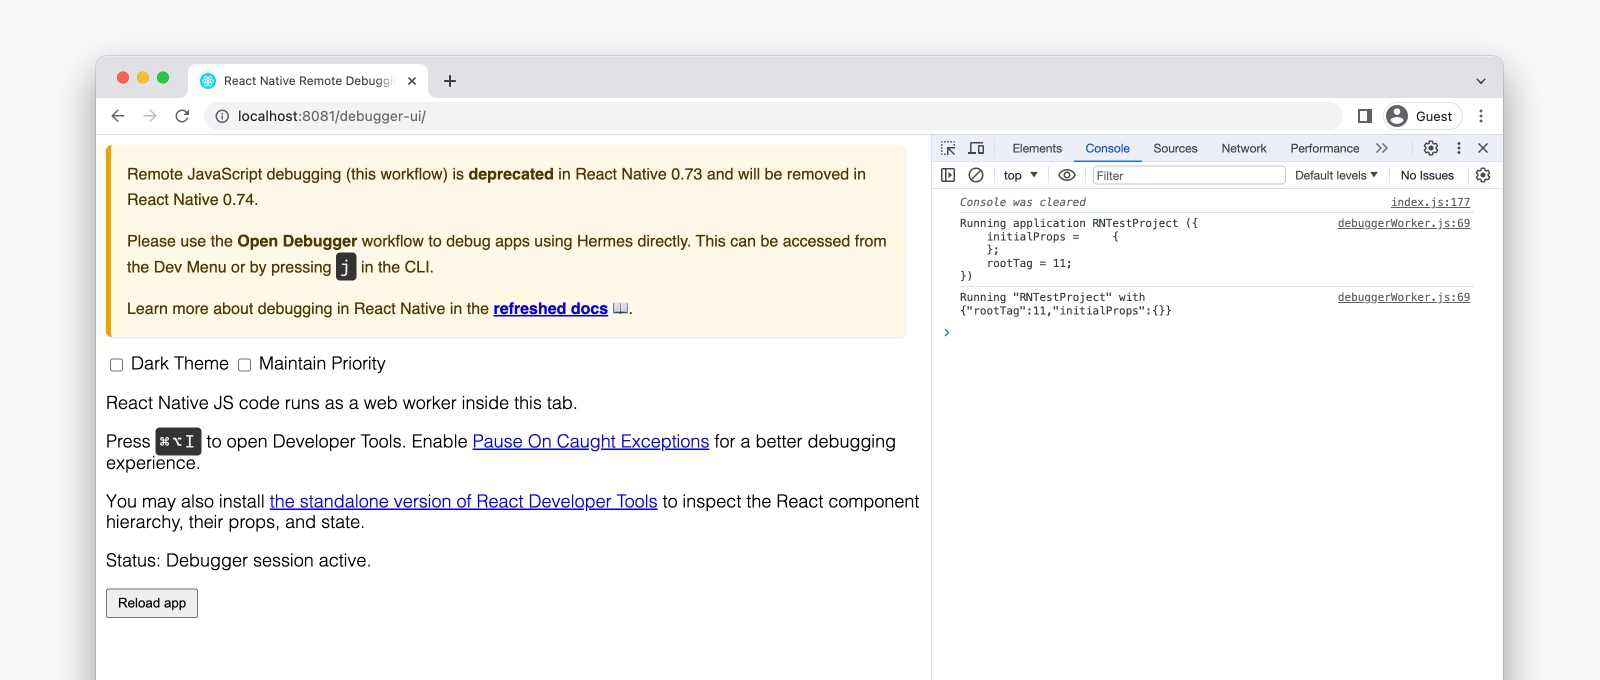
远程 JavaScript 调试(已弃用)

¥Remote JavaScript Debugging (deprecated)

警告

远程 JavaScript 调试在 React Native 0.73 中已弃用,并将在未来版本中删除。

¥Remote JavaScript Debugging is deprecated in React Native 0.73 and will be removed in a future release.

远程 JavaScript 调试将外部 Web 浏览器 (Chrome) 连接到你的应用,并在网页内运行你的 JavaScript 代码。这允许你像使用任何网络应用一样使用 Chrome 的调试器。请注意,浏览器环境可能非常不同,并且并非所有 React Native 模块在以这种方式调试时都能工作。

¥Remote JavaScript Debugging connects an external web browser (Chrome) to your app and runs your JavaScript code inside a web page. This allows you to use Chrome's debugger as you would with any web app. Note that the browser environment can be very different, and not all React Native modules will work when debugging this way.

设置

¥Setup

从 React Native 0.73 开始,必须使用 NativeDevSettings 模块手动启用远程 JavaScript 调试。

¥Since React Native 0.73, Remote JavaScript Debugging must be manually enabled using the NativeDevSettings module.

import NativeDevSettings from 'react-native/Libraries/NativeModules/specs/NativeDevSettings';

function MyApp() {
// Assign this to a dev-only button or useEffect call
const connectToRemoteDebugger = () => {
NativeDevSettings.setIsDebuggingRemotely(true);
};
}

当调用 NativeDevSettings.setIsDebuggingRemotely(true) 时,这将在 http://localhost:8081/debugger-ui 打开一个新选项卡。

¥When NativeDevSettings.setIsDebuggingRemotely(true) is invoked, this will open a new tab at http://localhost:8081/debugger-ui.

在此页面中,通过以下方式打开 Chrome DevTools:

¥From this page, open Chrome DevTools via:

  • 查看 > 开发者 > 开发者工具

    ¥View > Developer > Developer Tools

  • ⌥ Option + Cmd ⌘ + I (macOS) / Ctrl + Shift + I(Windows 和 Linux)。

    ¥⌥ Option + Cmd ⌘ + I (macOS) / Ctrl + Shift + I (Windows and Linux).

控制台和源面板将允许你检查 React Native 代码。

¥The Console and Sources panels will allow you to inspect your React Native code.

The remote debugger window in Chrome

信息

在远程 JavaScript 调试下,Chrome 中的 Web 版 React DevTools 将无法与 React Native 配合使用。请参阅 React 开发工具 指南,了解如何使用独立版本的 React DevTools。

¥Under Remote JavaScript Debugging, the web version of React DevTools in Chrome will not work with React Native. See the React DevTools guide to learn how to use the standalone version of React DevTools.

注意

在 Android 上,如果调试器和设备之间的时间发生漂移,动画和事件行为等内容可能无法正常工作。这可以通过运行 adb shell "date date +%m%d%H%M%Y.%S%3N" 来修复。如果使用物理设备,则需要根访问权限。

¥On Android, if the times between the debugger and device have drifted, things such as animations and event behavior might not work properly. This can be fixed by running adb shell "date `date +%m%d%H%M%Y.%S%3N`". Root access is required if using a physical device.

在物理设备上调试

¥Debugging on a physical device

信息

如果你使用的是 Expo CLI,则已经为你配置好了。

¥If you're using Expo CLI, this is configured for you already.

在通过 USB 连接的 Android 5.0+ 设备上,你可以使用 adb 命令行工具 设置从设备到计算机的端口转发:

¥On Android 5.0+ devices connected via USB, you can use the adb command line tool to set up port forwarding from the device to your computer:

adb reverse tcp:8081 tcp:8081
注意

如果你遇到任何问题,则可能是你的某个 Chrome 扩展程序以意外方式与调试器进行交互。尝试禁用所有扩展程序,然后一一重新启用它们,直到找到有问题的扩展程序。

¥If you run into any issues, it may be possible that one of your Chrome extensions is interacting in unexpected ways with the debugger. Try disabling all of your extensions and re-enabling them one-by-one until you find the problematic extension.