React Native DevTools
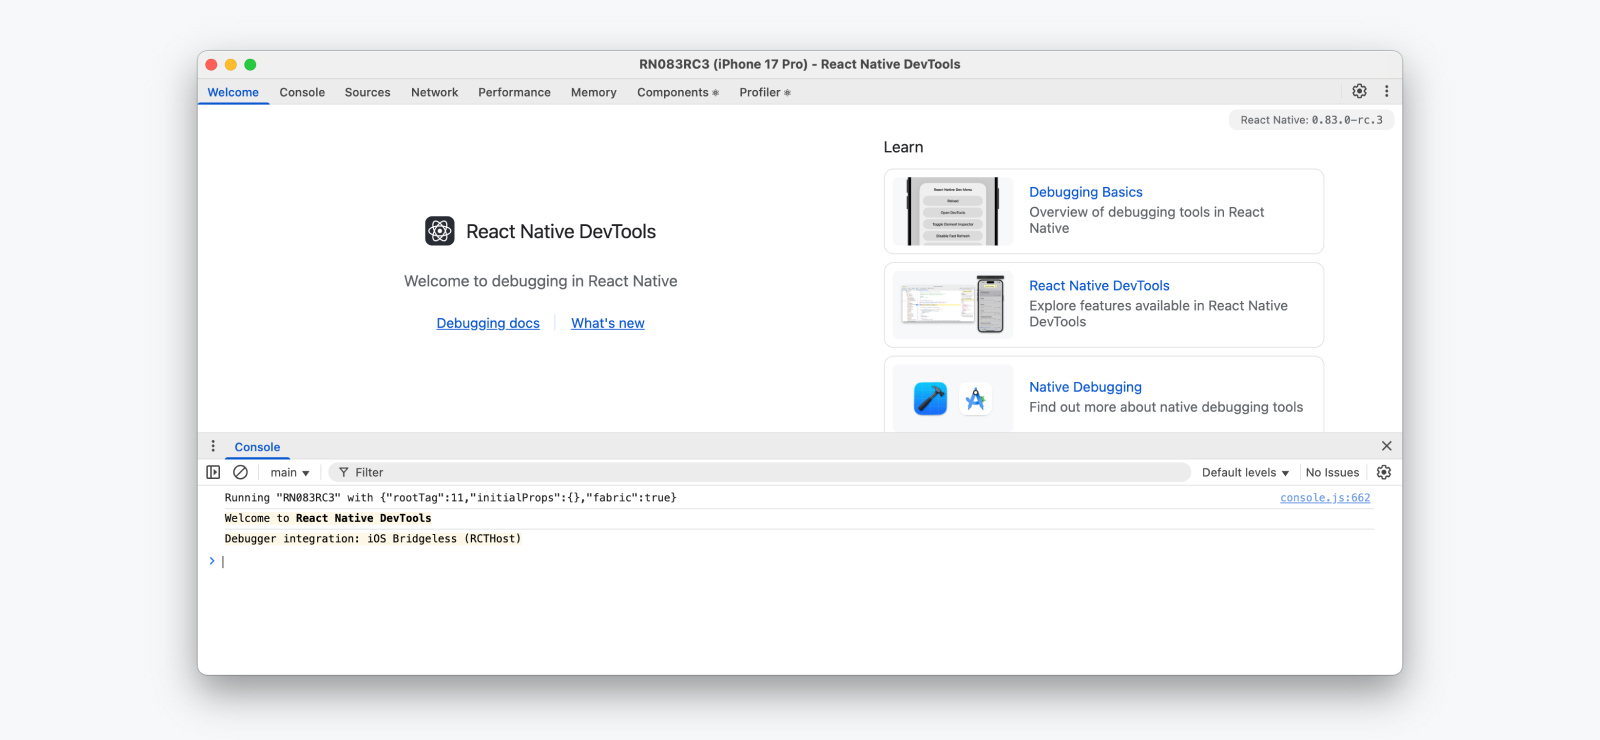
React Native DevTools 是我们针对 React Native 的现代调试体验。从头开始专门构建,旨在从根本上比以前的调试方法更加集成、正确和可靠。
¥React Native DevTools is our modern debugging experience for React Native. Purpose-built from the ground up, it aims to be fundamentally more integrated, correct, and reliable than previous debugging methods.
React Native DevTools 旨在调试 React 应用问题,而不是替代原生工具。如果你想检查 React Native 的底层平台层(例如,在开发 Native 模块时),请使用 Android Studio 和 Xcode 中提供的调试工具(参见 调试原生代码)。
¥React Native DevTools is designed for debugging React app concerns, and not to replace native tools. If you want to inspect React Native’s underlying platform layers (for example, while developing a Native Module), please use the debugging tools available in Android Studio and Xcode (see Debugging Native Code).
💡 Compatibility — released in 0.76
React Native DevTools 支持所有运行 Hermes 的 React Native 应用。它取代了以前的 Flipper、Experimental Debugger 和 Hermes 调试器(Chrome)前端。
¥React Native DevTools supports all React Native apps running Hermes. It replaces the previous Flipper, Experimental Debugger, and Hermes debugger (Chrome) frontends.
无法使用任何旧版本的 React Native 设置 React Native DevTools。
¥It is not possible to set up React Native DevTools with any older versions of React Native.
-
Chrome 浏览器 DevTools — 不支持
¥Chrome Browser DevTools — unsupported
-
不再支持通过
chrome://inspect连接到 React Native。功能可能无法正常工作,因为尚未测试最新版本的 Chrome DevTools(其构建为匹配最新的浏览器功能和 API),并且此前端缺少我们的定制。相反,我们随 React Native DevTools 一起提供了受支持的版本。¥Connecting to React Native via
chrome://inspectis no longer supported. Features may not work correctly, as the latest versions of Chrome DevTools (which are built to match the latest browser capabilities and APIs) have not been tested, and this frontend lacks our customisations. Instead, we ship a supported version with React Native DevTools.
-
-
Visual Studio Code — 不支持(预先存在)
¥Visual Studio Code — unsupported (pre-existing)
-
第三方扩展(例如 Expo Tools 和 Radon IDE)可能具有更好的兼容性,但 React 团队并不直接支持。
¥Third party extensions such as Expo Tools and Radon IDE may have improved compatibility, but are not directly supported by the React team.
-
💡 Feedback & FAQs
我们希望你用来在所有平台上调试 React 的工具可靠、熟悉、简单且具有凝聚力。本页描述的所有功能都是基于这些原则构建的,我们也希望在未来提供更多功能。
¥We want the tooling you use to debug React across all platforms to be reliable, familiar, simple, and cohesive. All the features described on this page are built with these principles in mind, and we also want to offer more capabilities in future.
我们正在积极迭代 React Native DevTools 的未来,并创建了一个集中的 GitHub 讨论 来跟踪问题、常见问题和反馈。
¥We are actively iterating on the future of React Native DevTools, and have created a centralized GitHub discussion to keep track of issues, frequently asked questions, and feedback.
核心功能
¥Core features
React Native DevTools 基于 Chrome DevTools 前端。如果你有 Web 开发背景,它的功能应该很熟悉。作为起点,我们建议浏览包含完整指南和视频资源的 Chrome DevTools 文档。
¥React Native DevTools is based on the Chrome DevTools frontend. If you have a web development background, its features should be familiar. As a starting point, we recommend browsing the Chrome DevTools docs which contain full guides as well as video resources.
控制台
¥Console
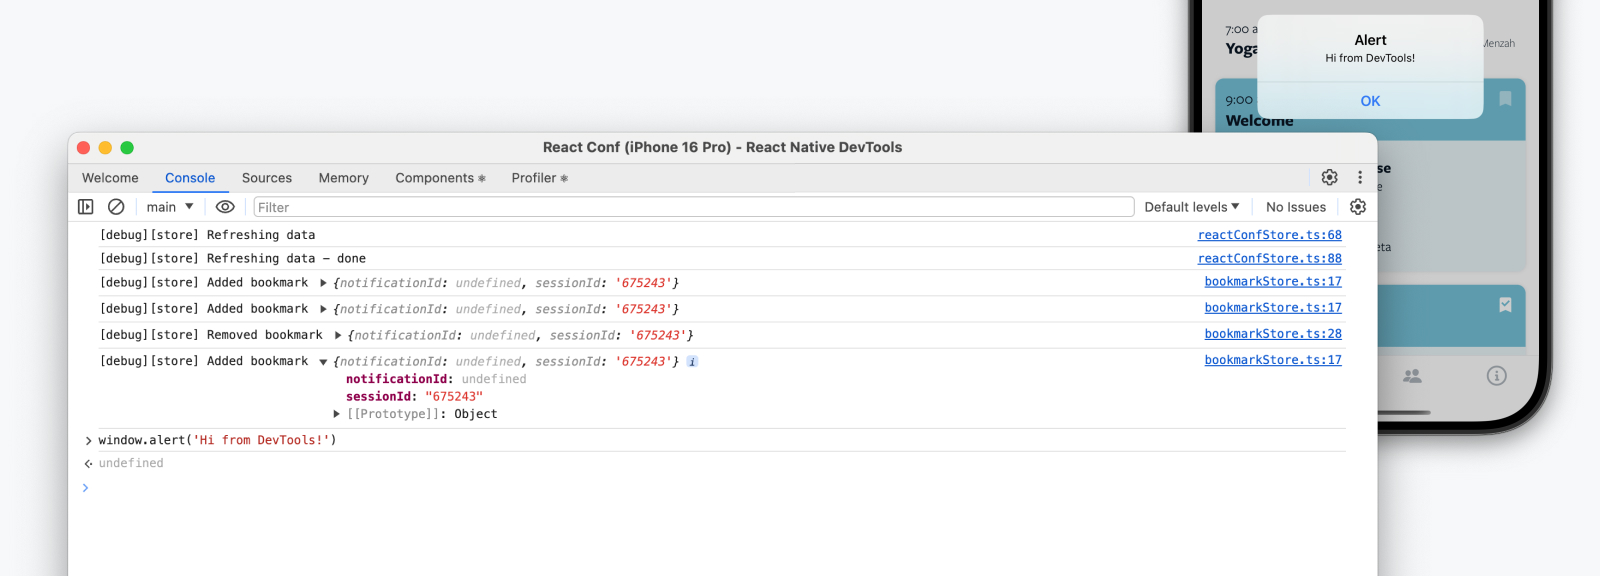
控制台面板允许你查看和过滤消息、评估 JavaScript、检查对象属性等。
¥The Console panel allows you to view and filter messages, evaluate JavaScript, inspect object properties, and more.
¥Console features reference | Chrome DevTools
有用的提示
¥Useful tips
-
如果你的应用有很多日志,请使用过滤框或更改显示的日志级别。
¥If your app has a lot of logs, use the filter box or change the log levels that are shown.
-
使用 实时表达式 观察随时间变化的值。
¥Watch values over time with Live Expressions.
-
使用 保留日志 在重新加载时保留消息。
¥Persist messages across reloads with Preserve Logs.
-
使用 Ctrl + L 清除控制台视图。
¥Use Ctrl + L to clear the console view.
来源和断点
¥Sources & breakpoints
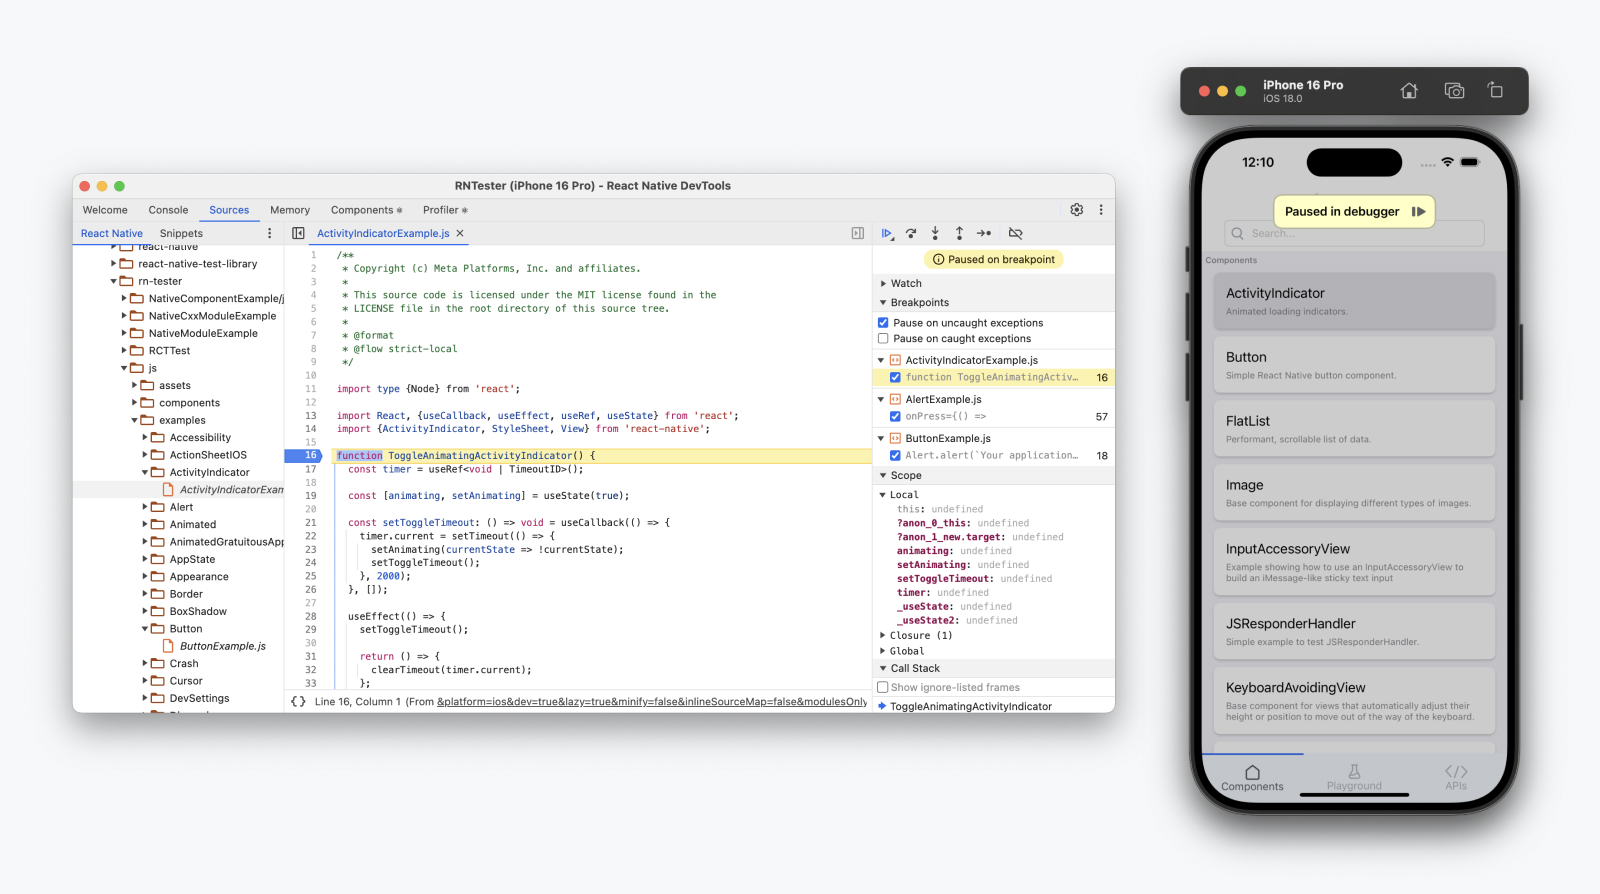
Sources 面板允许你查看应用中的源文件并注册断点。使用断点定义你的应用应暂停的代码行 - 允许你检查程序的实时状态并逐步执行代码。
¥The Sources panel allows you to view the source files in your app and register breakpoints. Use a breakpoint to define a line of code where your app should pause — allowing you to inspect the live state of the program and incrementally step through code.
¥Pause your code with breakpoints | Chrome DevTools
迷你指南
¥Mini-guide
断点是调试工具包中的一个基本工具!
¥Breakpoints are a fundamental tool in your debugging toolkit!
-
使用侧边栏或 Cmd ⌘+P / Ctrl+P 导航到源文件。
¥Navigate to a source file using the sidebar or Cmd ⌘+P / Ctrl+P.
-
单击代码行旁边的行号列以添加断点。
¥Click in the line number column next to a line of code to add a breakpoint.
-
暂停时使用右上角的导航控件转到 单步执行代码。
¥Use the navigation controls at the top right to step through code when paused.
有用的提示
¥Useful tips
-
当你的应用暂停时,会显示 "在调试器中暂停" 叠加层。点击它以恢复。
¥A "Paused in Debugger" overlay appears when your app is paused. Tap it to resume.
-
处于断点时,请注意右侧面板,它们允许你检查当前作用域和调用堆栈,并设置监视表达式。
¥Pay attention to the right-hand panels when on a breakpoint, which allow you to inspect the current scope and call stack, and set watch expressions.
-
使用
debugger;语句从文本编辑器快速设置断点。这将通过快速刷新立即到达设备。¥Use a
debugger;statement to quickly set a breakpoint from your text editor. This will reach the device immediately via Fast Refresh. -
有多种断点!例如,条件断点和日志点。
¥There are multiple kinds of breakpoints! For example, Conditional Breakpoints and Logpoints.
网络 自 0.83 版本起
¥Network
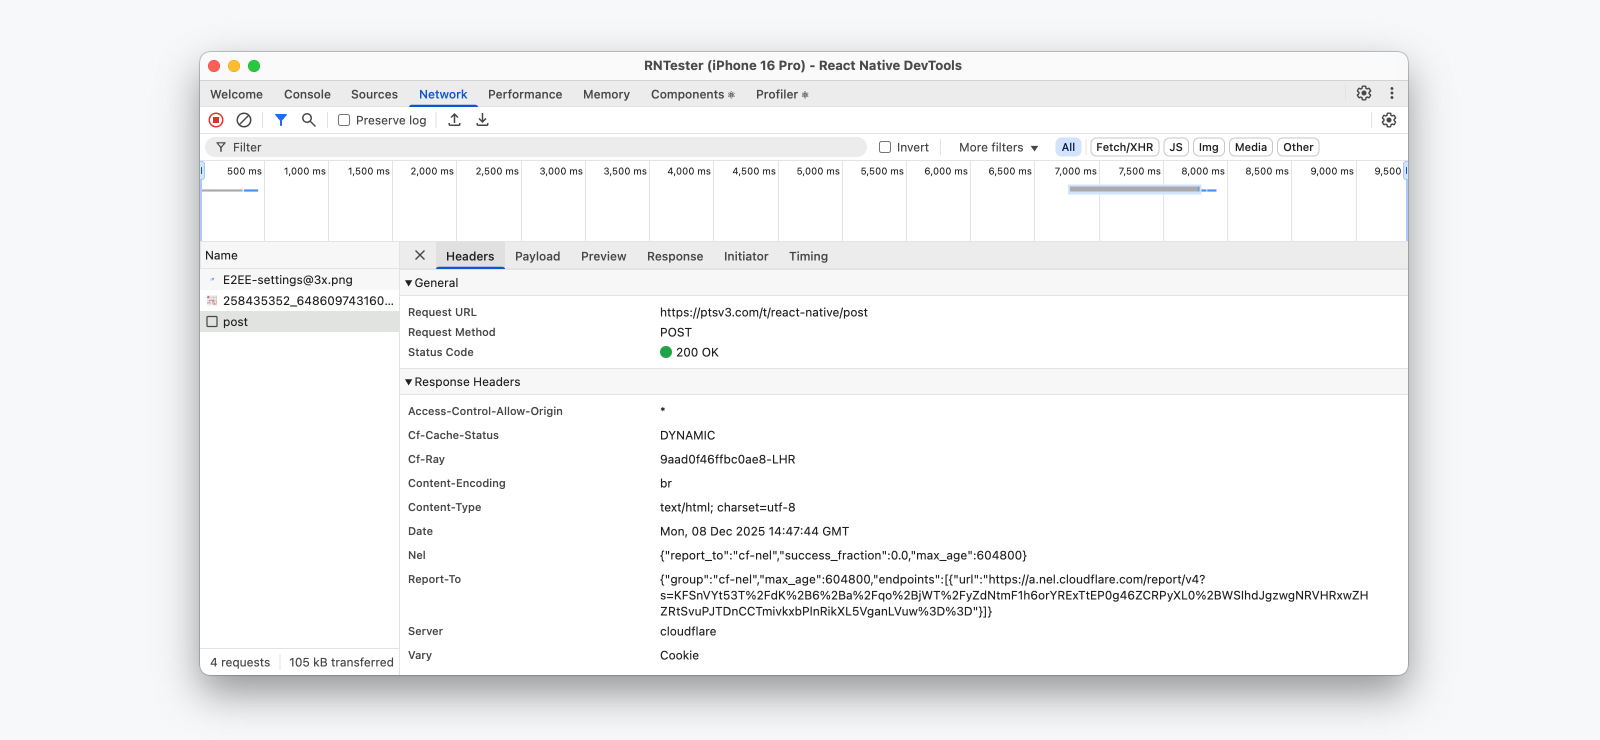
网络面板允许你查看和检查应用发出的网络请求。已记录的请求提供详细的元数据,例如发送/接收的计时和标头,以及响应预览。
¥The Network panel allows you to view and inspect the network requests made by your app. Logged requests provide detailed metadata such as timings and headers sent/received, as well as response previews.
当 DevTools 打开时,网络请求会自动记录。我们支持 Chrome 的大部分功能,但也有一些例外。更多信息请参见下文。
¥Network requests are recorded automatically when DevTools is open. We support most features from Chrome, with some exceptions. See more below.
💡 Network event coverage, Expo support
哪些网络事件会被捕获?
¥Which network events are captured?
目前,我们通过 fetch()、XMLHttpRequest 和 <Image> 记录所有网络调用 - 对自定义网络库(例如 Expo Fetch)的支持将在稍后推出。
¥Today, we record all network calls through fetch(), XMLHttpRequest, and <Image> — with support for custom networking libraries, such as Expo Fetch, coming later.
Expo 网络差异
¥Expo Network differences
因此,使用 Expo 的应用将继续看到 "Expo 网络" 面板 - 这是 Expo 框架的一个独立实现,它会记录这些额外的请求源,但功能略有减少。
¥Because of this, apps using Expo will continue to see the "Expo Network" panel — a separate implementation by the Expo framework which will log these additional request sources but has slightly reduced features.
-
覆盖 Expo 特有的网络事件。
¥Coverage for Expo-specific network events.
-
不支持请求发起程序。
¥No request initiator support.
-
不支持性能面板集成。
¥No Performance panel integration.
我们正在与 Expo 合作,在未来的版本中将 Expo Fetch 和第三方网络库集成到我们新的网络检测管道中。
¥We're working with Expo to integrate Expo Fetch and third party networking libraries with our new Network inspection pipeline in future releases.
未实现的功能
¥Unimplemented features
在发布时,以下功能我们尚未在 React Native 中支持:
¥At launch, these are the features we don't yet support in React Native:
-
WebSocket 事件
¥WebSocket events
-
网络响应模拟
¥Network response mocking
-
模拟网络限速
¥Simulated network throttling
💡 Response previews buffer size
如果你正在检查大量响应数据,请注意,响应预览会缓存在设备端缓冲区中,最大容量为 100MB。这意味着如果缓存过大,我们会清除响应预览(但不会清除元数据),并优先清除最早的请求。
¥If you are inspecting a large volume of response data, please note that response previews are cached in an on-device buffer with a maximum size of 100MB. This means we may evict response previews (but not metadata) if the cache becomes too large, oldest request first.
有用的提示
¥Useful tips
-
使用“发起方”选项卡查看应用中网络请求的发起调用堆栈。
¥Use the Initiator tab to see the call stack of where a network request was initiated in your app.
-
网络事件也会显示在“性能”面板的“网络”跟踪中。
¥Network events will also be shown in the Network track in the Performance panel.
性能 自 0.83 版本起
¥Performance
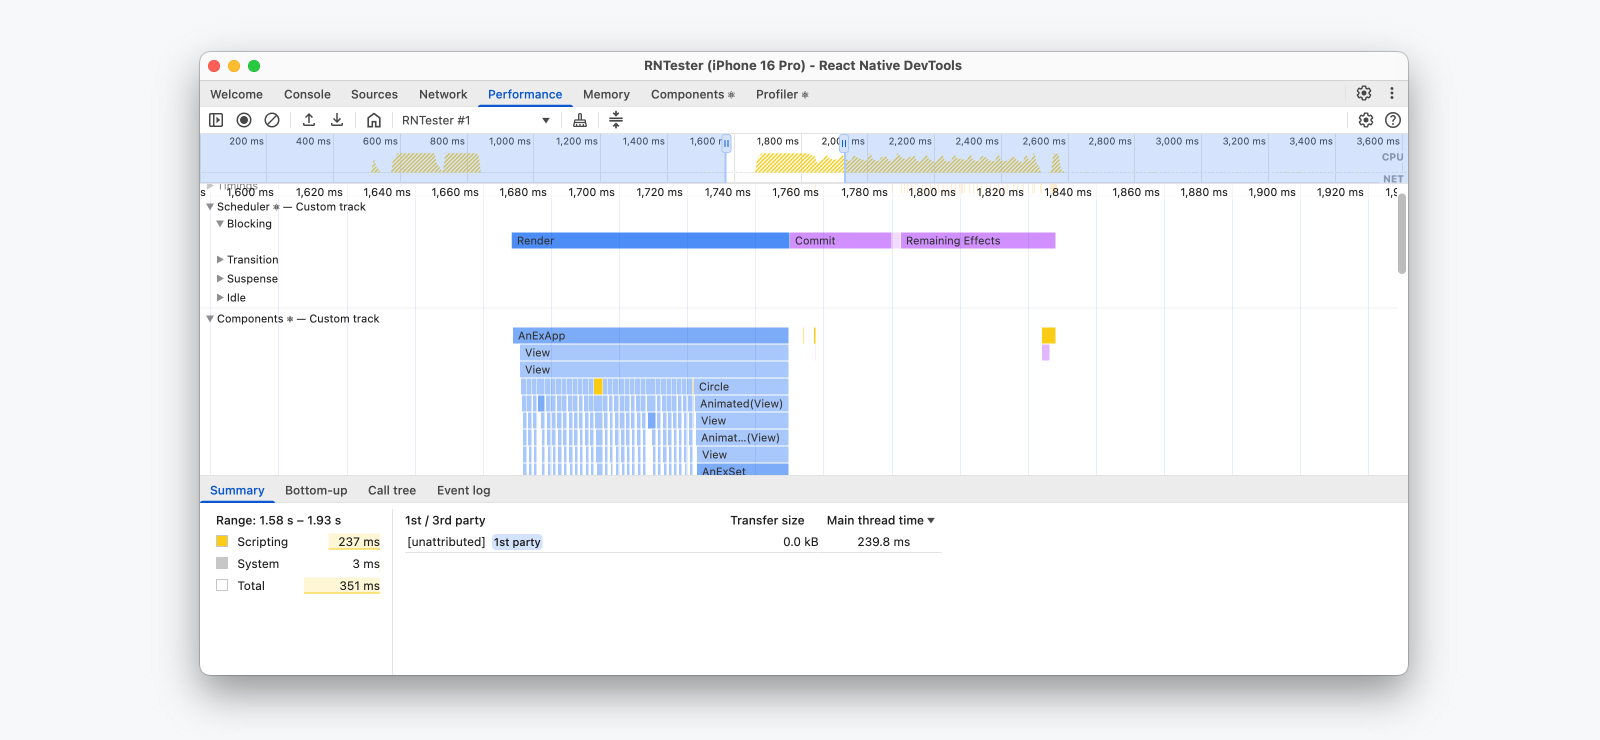
性能跟踪允许你在应用内记录性能会话,以了解 JavaScript 代码的运行情况以及哪些操作耗时最长。在 React Native 中,我们会在单个性能时间轴中显示 JavaScript 执行情况、React 性能跟踪、网络事件和自定义 用户计时。
¥Performance tracing allows you to record a performance session within your app to understand how your JavaScript code is running and what operations took the most time. In React Native, we show JavaScript execution, React Performance tracks, Network events, and custom User Timings, rendered in a single performance timeline.
有用的提示
¥Useful tips
-
使用 注释 标记性能跟踪 - 在与队友一起使用 下载和分享 之前非常有用。
¥Use Annotations to label and mark up a performance trace — useful before downloading and sharing with a teammate.
-
在应用中使用
PerformanceObserverAPI 来观察运行时性能事件 - 如果你想要捕获性能遥测数据,这将非常有用。¥Use the
PerformanceObserverAPI in your app to observe performance events at runtime — useful if you want to capture performance telemetry.
了解更多
¥Learn more
-
"像资深开发者一样调试 — React Native 性能面板" |软件大厦
¥"Debug Like a Senior — React Native Performance Panel" | Software Mansion
内存
¥Memory
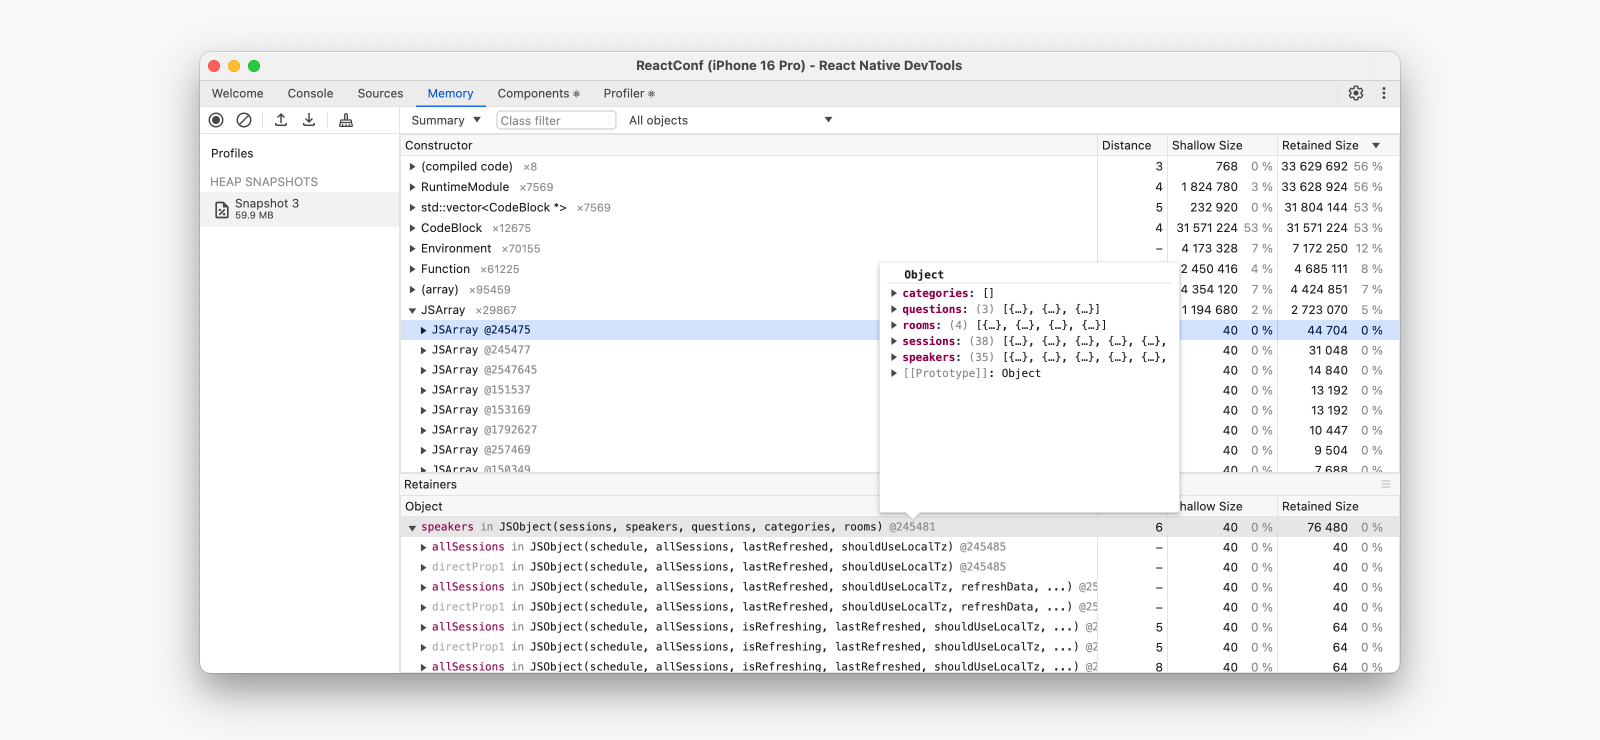
“内存”面板允许你获取堆快照并查看 JavaScript 代码随时间变化的内存使用情况。
¥The Memory panel allows you to take a heap snapshot and view the memory usage of your JavaScript code over time.
¥Record heap snapshots | Chrome DevTools
有用的提示
¥Useful tips
-
使用 Cmd ⌘+F / Ctrl+F 过滤堆中的特定对象。
¥Use Cmd ⌘+F / Ctrl+F to filter for specific objects in the heap.
-
使用 分配时间线报告 可以以图表的形式查看随时间变化的内存使用情况,从而识别可能的内存泄漏。
¥Taking an allocation timeline report can be useful to see memory usage over time as a graph, to identify possible memory leaks.
React DevTools 功能
¥React DevTools features
在集成的组件和 Profiler 面板中,你将找到 React DevTools 浏览器扩展的所有功能。它们在 React Native DevTools 中无缝工作。
¥In the integrated Components and Profiler panels, you'll find all the features of the React DevTools browser extension. These work seamlessly in React Native DevTools.
React 组件
¥React Components

“React 组件”面板允许你检查和更新渲染的 React 组件树。
¥The React Components panel allows you to inspect and update the rendered React component tree.
-
在 DevTools 中悬停或选择一个元素,即可在设备上高亮显示。
¥Hover or select an element in DevTools to highlight it on the device.
-
要在 DevTools 中找到元素,请单击左上角的 "选择元素" 按钮,然后点击应用中的任意元素。
¥To locate an element in DevTools, click the top-left "Select element" button, then tap any element in the app.
有用的提示
¥Useful tips
-
可以在运行时使用右侧面板查看和修改组件上的属性和状态。
¥Props and state on a component can be viewed and modified at runtime using the right hand panel.
-
使用 React 编译器 优化的组件将用 "备忘录 ✨" 徽章注释。
¥Components optimized with React Compiler will be annotated with a "Memo ✨" badge.
专业提示:高亮重新渲染
¥Protip: Highlight re-renders
重新渲染可能是 React 应用性能问题的重要因素。DevTools 可以高亮组件重新渲染。
¥Re-renders can be a significant contributor to performance issues in React apps. DevTools can highlight component re-renders as they happen.
-
要启用,请单击“查看设置(
⚙︎)”图标并选中 "组件渲染时高亮更新"。¥To enable, click the View Settings (
⚙︎) icon and check "Highlight updates when components render".
React Profiler
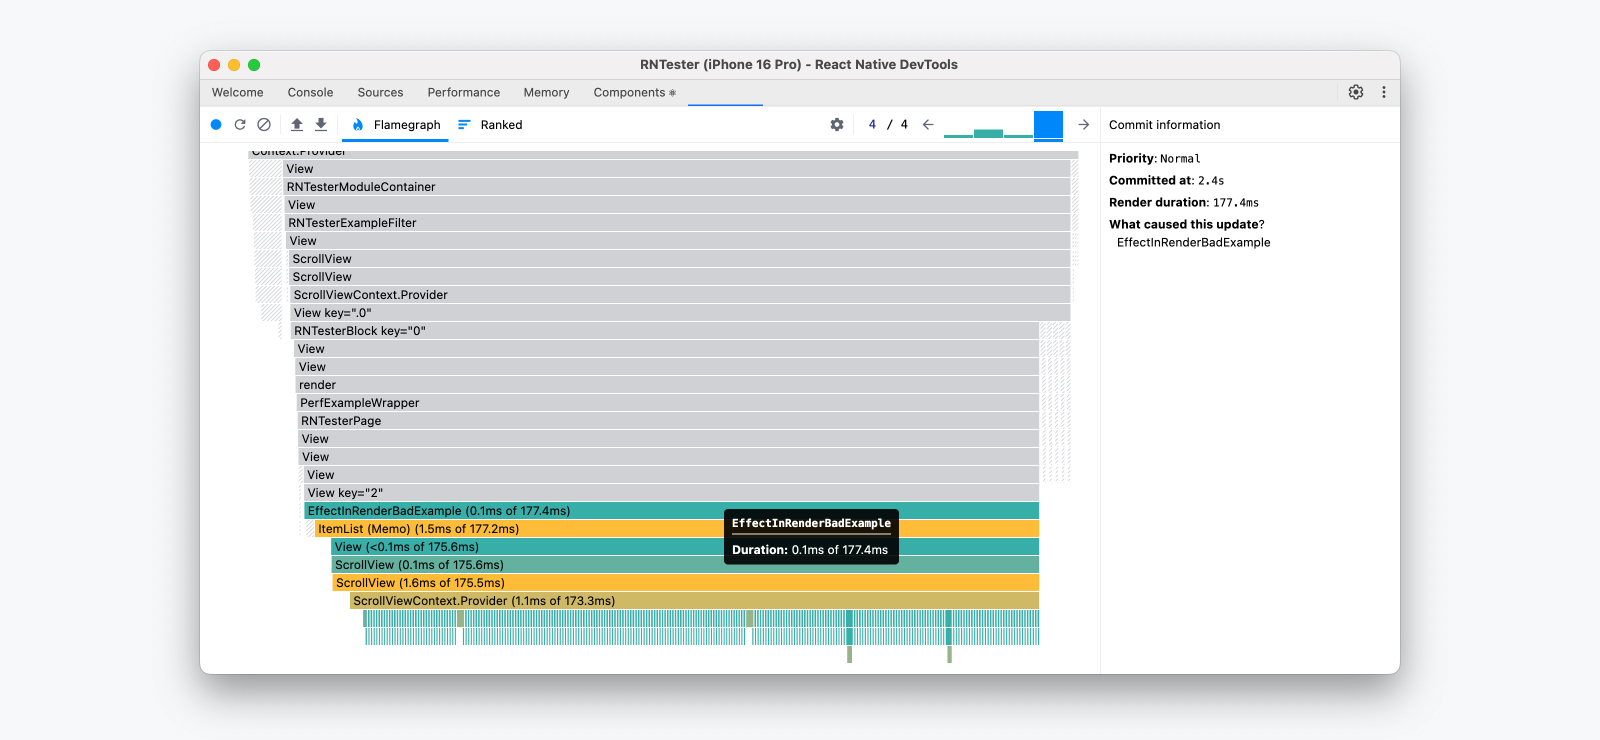
“React Profiler”面板允许你记录性能配置文件,以了解组件渲染和 React 提交的时间。
¥The React Profiler panel allows you to record performance profiles to understand the timing of component renders and React commits.
有关更多信息,请参阅 原始 2018 指南(请注意,其中的部分内容可能已过时)。
¥For more info, see the original 2018 guide (note that parts of this may be outdated).
重新连接 DevTools
¥Reconnecting DevTools
有时,DevTools 可能会断开与目标设备的连接。如果出现以下情况,则会发生这种情况:
¥Occasionally, DevTools might disconnect from the target device. This can happen if:
-
应用已关闭。
¥The app is closed.
-
应用已重建(安装了新的原生版本)。
¥The app is rebuilt (a new native build is installed).
-
应用在原生端崩溃。
¥The app crashes on the native side.
-
开发服务器 (Metro) 已退出。
¥The dev server (Metro) is quit.
-
物理设备已断开连接。
¥A physical device is disconnected.
断开连接时,将显示一个带有消息 "调试连接已关闭" 的对话框。
¥On disconnect, a dialog will be shown with the message "Debugging connection was closed".
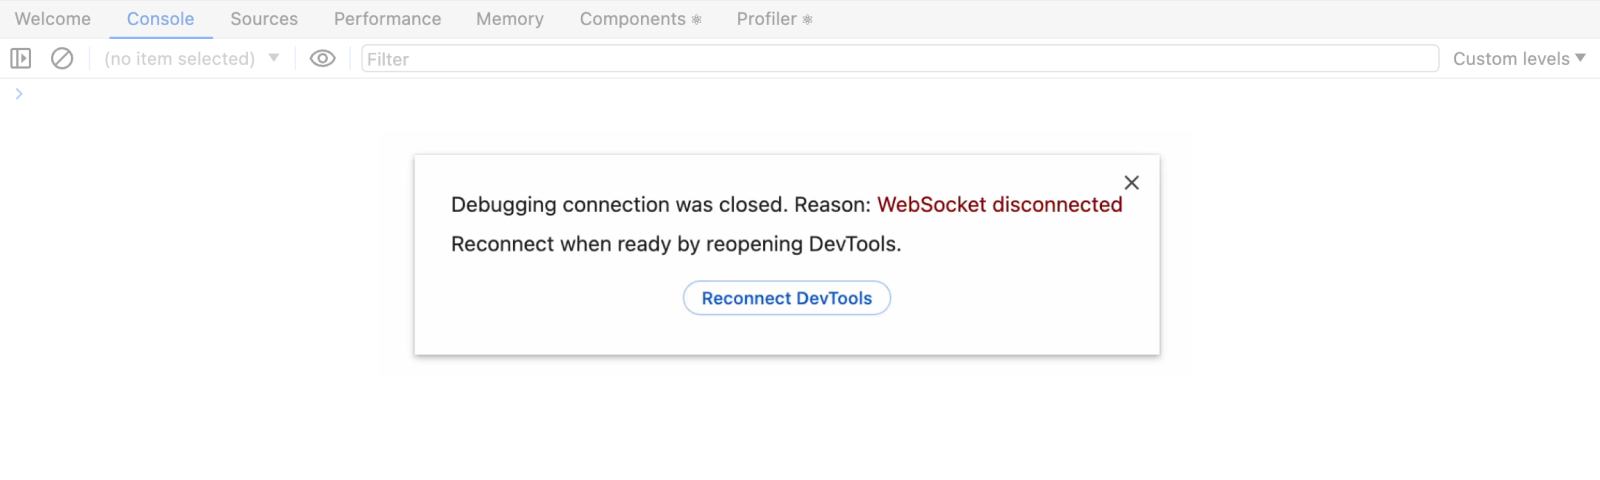
从这里,你可以:
¥From here, you can either:
-
Dismiss:选择关闭 (
×) 图标或单击对话框外部以返回到断开连接前的最后状态的 DevTools UI。¥Dismiss: Select the close (
×) icon or click outside the dialog to return to the DevTools UI in the last state before disconnection. -
重新连接:选择 "重新连接 DevTools",解决断开连接的原因。
¥Reconnect: Select "Reconnect DevTools", having addressed the reason for disconnection.